July 24, 2021
 Data visualization is a key step in a data science pipeline. Python offers great possibilities when it comes to representing some data graphically, but it can be hard and time-consuming to create the appropriate chart.
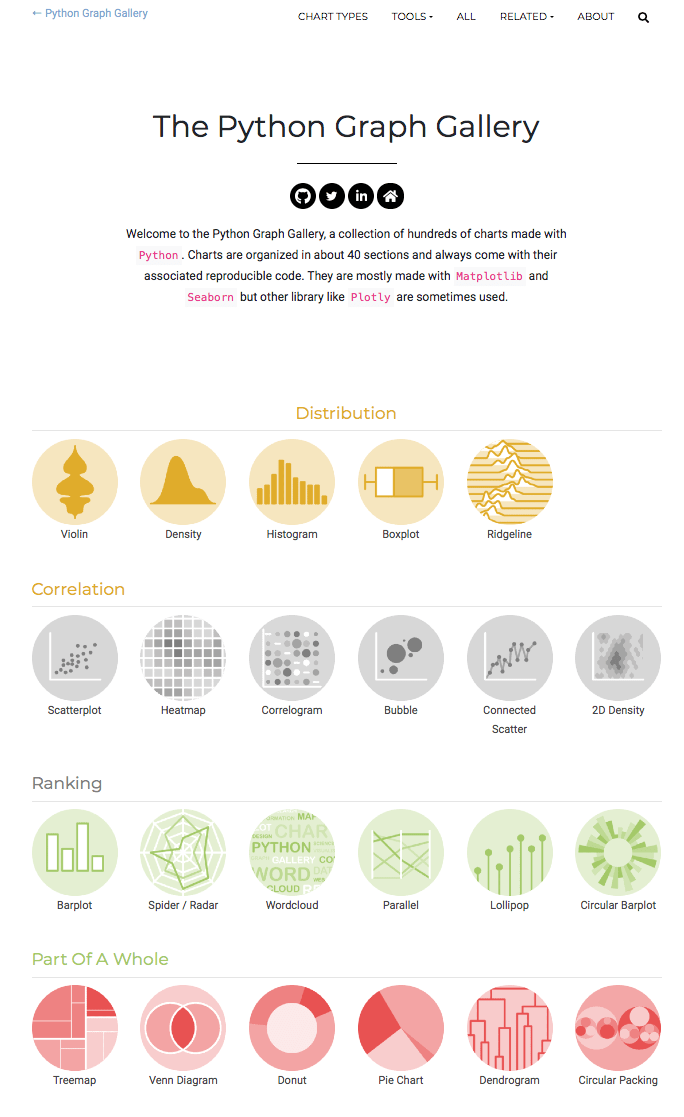
The Python Graph Gallery is here to help. It displays many examples, always providing the reproducible code. It allows to build the desired chart in minutes.
About 400 charts in 40 sections The gallery currently provides more than 400 chart examples.
Data visualization is a key step in a data science pipeline. Python offers great possibilities when it comes to representing some data graphically, but it can be hard and time-consuming to create the appropriate chart.
The Python Graph Gallery is here to help. It displays many examples, always providing the reproducible code. It allows to build the desired chart in minutes.
About 400 charts in 40 sections The gallery currently provides more than 400 chart examples.Data visualization is a key step in a data science pipeline. Python offers great possibilities when it comes to representing some data graphically, but it can be hard and time-consuming to create the appropriate chart.
The Python Graph Gallery is here to help. It displays many examples, always providing the reproducible code. It allows to build the desired chart in minutes.
About 400 charts in 40 sections The gallery currently provides more than 400 chart examples.
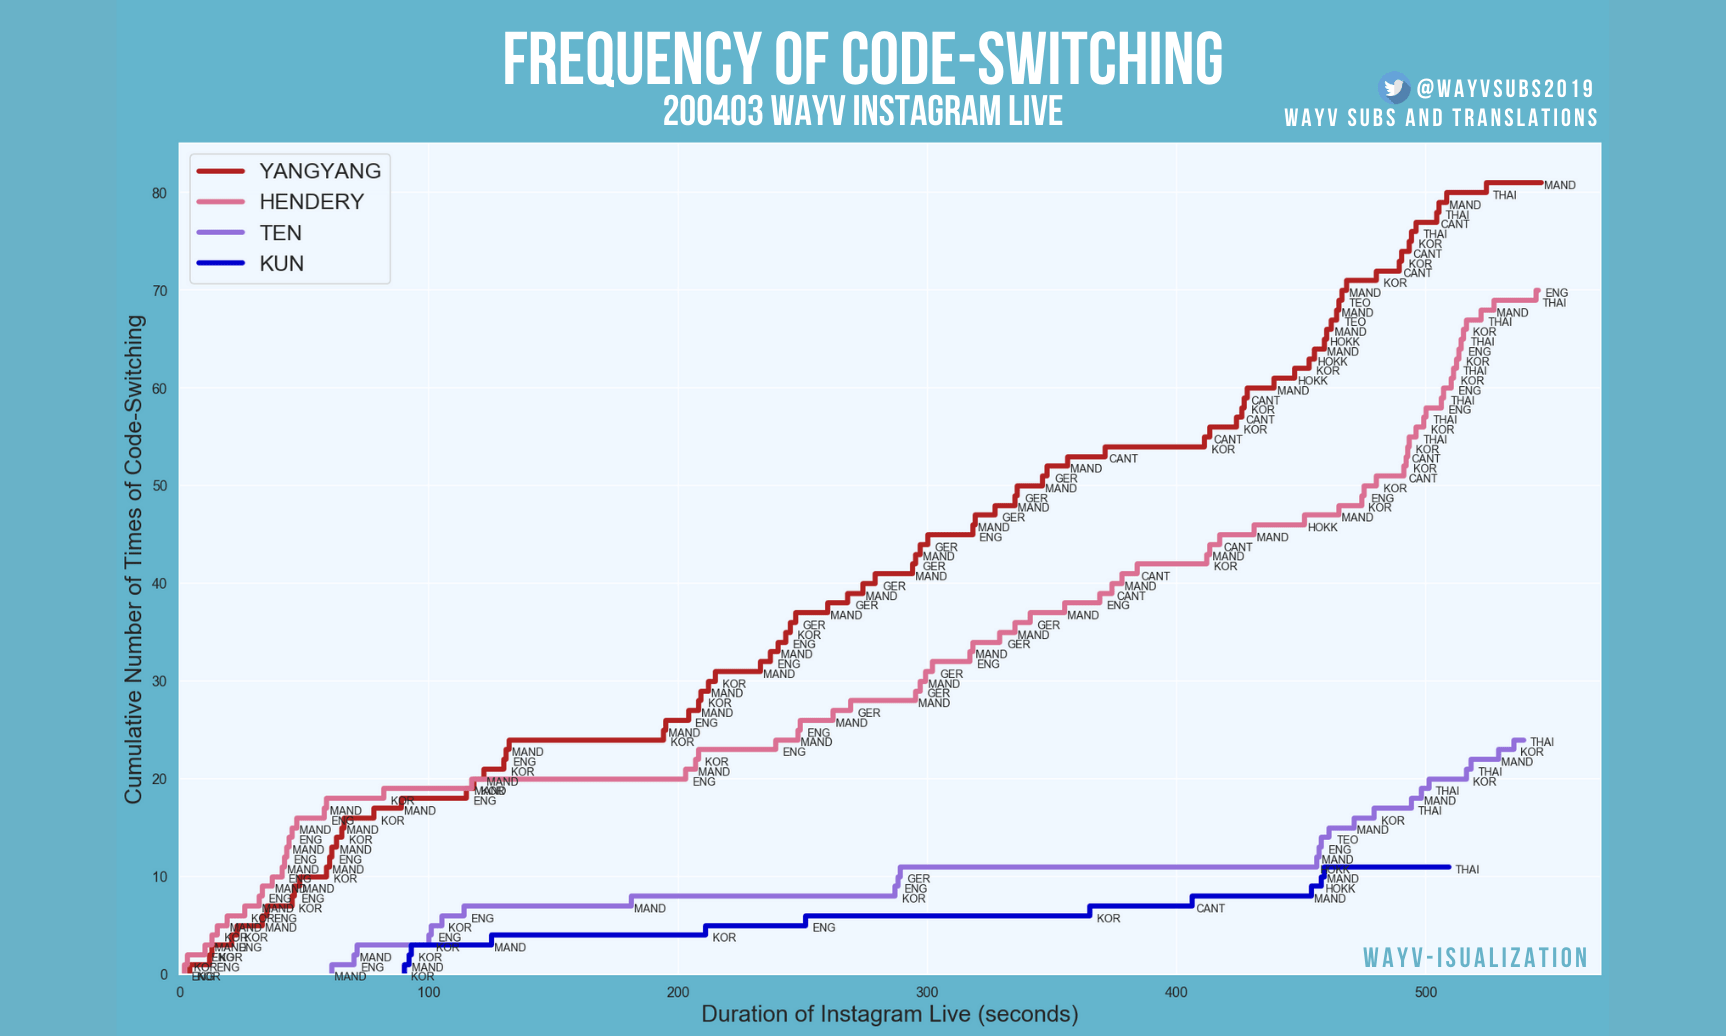 Introduction Code-switching is the practice of alternating between two or more languages in the context of a single conversation, either consciously or unconsciously. As someone who grew up bilingual and is currently learning other languages, I find code-switching a fascinating facet of communication from not only a purely linguistic perspective, but also a social one. In particular, I’ve personally found that code-switching often helps build a sense of community and familiarity in a group and that the unique ways in which speakers code-switch with each other greatly contribute to shaping group dynamics.
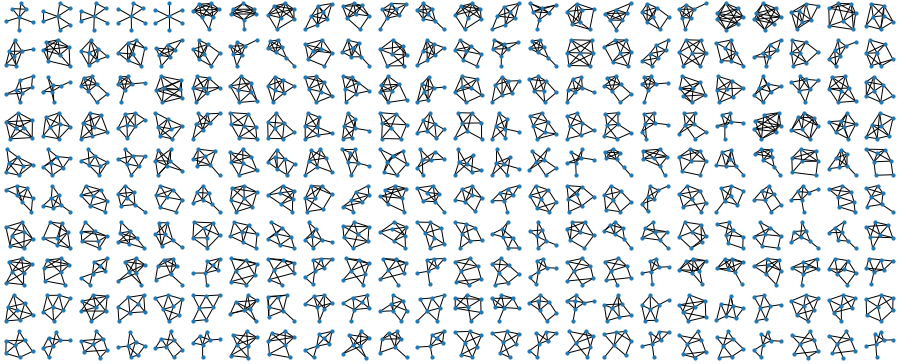 The other day I was homeschooling my kids, and they asked me: “Daddy, can you draw us all possible non-isomorphic graphs of 3 nodes”? Or maybe I asked them that? Either way, we happily drew all possible graphs of 3 nodes, but already for 4 nodes it got hard, and for 5 nodes - plain impossible!
So I thought: let me try to write a brute-force program to do it! I spent a few hours sketching some smart dynamic programming solution to generate these graphs, and went nowhere, as apparently the problem is quite hard.
The other day I was homeschooling my kids, and they asked me: “Daddy, can you draw us all possible non-isomorphic graphs of 3 nodes”? Or maybe I asked them that? Either way, we happily drew all possible graphs of 3 nodes, but already for 4 nodes it got hard, and for 5 nodes - plain impossible!
So I thought: let me try to write a brute-force program to do it! I spent a few hours sketching some smart dynamic programming solution to generate these graphs, and went nowhere, as apparently the problem is quite hard.